
Developers love Python because it's quick to write, easy to learn, and is --
mostly -- fast enough. The qualifier there means you'll have situations where
it just isn't. There's good news -- You have plenty of options to make your
code faster.
- Profile and optimize your existing code
- Use a C module (or write your own)
- Try a JIT-enabled interpreter like Jython or PyPy
- Parallelize your workload
The difficulty of each depends heavily on your program. We'll be talking about
profiling and optimizing pure Python code with the help of a few tools. In this
article, we'll see how to use profilers to improve disq's performance
by about a third.
Optimizating Python -- The How and Why
Before we get down business, let's talk about optimization. Optimization isn't about flailing around tossing@lru_cache around all your functions.
Instead, it's a series of simple steps repeated until your program is "fast
enough".
First, know your behaviors. The easiest way to make a program 100% faster is to
echo 'exit(99)' > server.py, but that takes the "viable" out of your
MVP. If it wasn't necessary, we wouldn't be optimizing it. You need to
be able to repeatably verify your application is correct with automated --
ideally fast -- tests at the unit and system level.
Next, pick a metric to optimize for. You'll be trading between several
dimensions, so know what matters to you. Memory usage, CPU time, bandwidth,
disk I/O, and storage space are all factors you'll find yourself trading
between in a sufficiently large application. Build measurements into your
automated tests, or make a separate system. The closer to real world usage you
can make these performance metrics, the better off you will be. Performance is
sensitive to more factors than you can count: CPU cache size, network buffer
size, kernel version, operating system, dependency versions, and more can all
skew your numbers.
You have a goal: use less blank, or do blank faster. You know how much
blank you're using and are ready to start changing things. Look at the
metrics and find where you can have the biggest impact. Where is the hottest
loop, the biggest object, or the most expensive operation?
The software we'll be optimizing is Disq, a client for
Disque. Disque is still in alpha and hasn't been rigorously
benchmarked, profiling the client is still worthwhile. We'll follow the steps
outlined earlier: verify, measure, alter, repeat. The "verify" step is already
handled for this client, let's dive into the measuring.
Optimize Slow Code First
The use case we'll be optimizing for is the fast consumption and
acknowledgement of jobs by workers. Disque is built for many small jobs, so it
makes sense that each worker would be consuming huge numbers of them. We'll
pretend we have a worker program that follows (roughly) these steps.
- Get a job (or wait for one)
- Do some work
- Acknowledge the job is done (so disque doesn't retry)
- Repeat forever
We're already doing the work in literally no time, so now we want to trim the
fat from our Disque client so we can process more jobs.
benchmarking_script.py
from disq import Disque
@profile
def read_jobs():
 client = Disque()
 while True:
 job = client.getjob('q', timeout_ms=1)
 if job is None:
 break
 """normally you'd do work here"""
 client.ackjob(job[1])
read_jobs benchmark function.
Lineprof provides the kernprof command that will collect information about
the code.// -l forces line-by-line profiling
// -v prints the results of the profiling immediately
$ kernprof -l -v first_script.py
Timer unit: 1e-06 s (microsecond)
Function: read_jobs
Line num Hits Time Per Hit % Time Line Contents
5 @profile
6 def read_jobs():
7 1 2273 2273.0 0.3 client = Disque()
8 1001 1776 1.8 0.2 while True:
9 1001 530698 530.2 65.6 job = client.getjob('q', timeout_ms=1)
10 1001 1282 1.3 0.2 if job is None:
11 1 2 2.0 0.0 break
12 // normally you'd do work here
13 1000 273414 273.4 33.8 client.ackjob(job[1])
Immediately, we can see that acknowledging a job takes half as long as
retrieving one. We need to add the
@profile decorator to the getjob
function in the disq client.py. This turns out to be uninformative because
getjob just calls self._getjob.Interactive Profiling for Python
We could continue decorating each level and viewing the results; instead let's try a different tool. There's an interactive profiler for Python that covers our needs a bit better.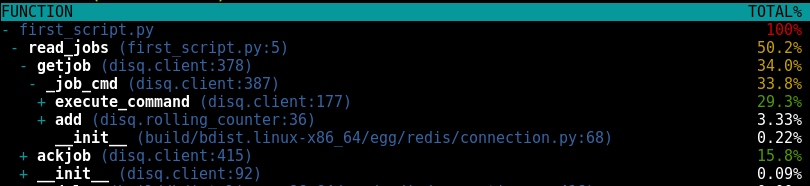
We can drill right down to see where the most time is being spent. A full 11 percent of the time is being spent just getting the a connection. No network action, just pulling a connection to use from the pool.
That time is being spent in this snippet of
rolling_counter (full code
available here).def _expire(self)
""" called when a connection is retrieved """
""" cast key iterable to list because this loop can delete keys"""
for k in list(six.iterkeys(self._counts)):
""" find the location where all times are less than (current - ttl)
and delete all lesser elements """
del self._counts[k][
:self._counts[k].bisect(time.time() - self._ttl_seconds)
]
if len(self._counts[k]) == 0:
self.remove(k)
bisect a sorted list then slice it to remove times
older than the sliding window of messages. Why is that there?If a consumer sees a high message rate received from foreign nodes, it may optionally have logic in order to retrieve messages directly from the nodes where producers are producing the messages for a given topic. The consumer can easily check the source of the messages by checking the Node ID prefix in the messages IDs.It's an optional behavior that accounts 11% of the time it takes to send a message out. Turns out that's an expensive default, but I had implemented it without checking its impact on performance (there's a lesson there). Let's make it optional, since not all users will want to take the performance penalty.
-- disque docs
With the option in place, let's see the difference between enabled and
disabled.
With connection counting
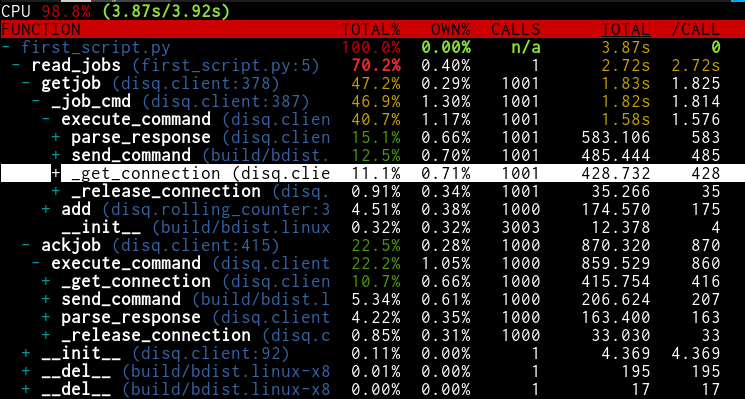
We pay almost a full second of execution time over 1000 messages to count how many jobs come from each node in the cluster. If you're keeping score at home, that's a full millisecond per message.
Without connection counting
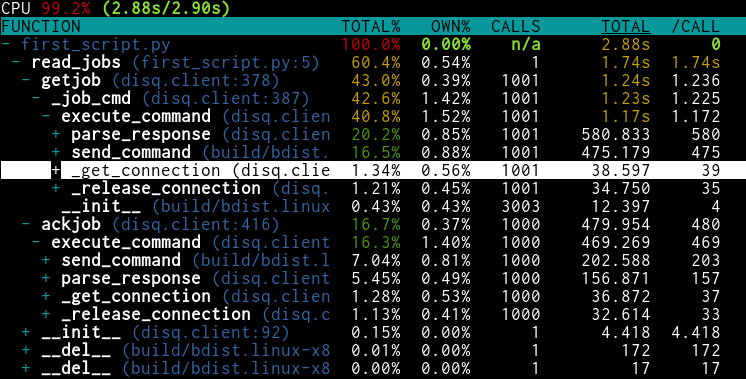
Without job source counting, the total runtime decreases from 3.87 to 2.88
seconds. This is definitely worth a change to the library's default behavior.
Speeding Up RollingCounter
Now let's try to improve connection counting for users that do want it. Here's a starting point (courtesy of lineprof).File: counting_profiler.py
Function: count_incoming at line 7
Line num Hits Time Per Hit % Time Line Contents
7 @profile
8 def count_incoming():
9 // Set the count lifetime really low
10 1 11 11.0 0.0 rc = RollingCounter(ttl_secs=0.1)
11 10001 10424 1.0 2.5 for i, _ in izip(cycle('1234567890'), xrange(10000)):
12 10000 306433 30.6 73.4 rc.add(i)
13
14 66 29167 441.9 7.0 while rc.max() is not None:
15 65 71697 1103.0 17.2 sleep(0.001)
Ok, so adding takes a hefty 73% of our runtime, and it's going to be the most
frequently run, and most of that time is spent adding the time to the
Switching from sortedlist of times messages were received. Think for a second: time is only
ever going to increase, so we can safely change to an unsorted list and use
append to skip the cost of sorting values.blist.sortedlist to list only required 3 changed lines,
here's the commit that made the change.File: counting_profiler.py
Function: count_incoming at line 7
Line num Hits Time Per Hit % Time Line Contents
7 @profile
8 def count_incoming():
9 // Set the count lifetime really low
10 1 11 11.0 0.0 rc = RollingCounter(ttl_secs=0.1)
11 10001 8098 0.8 6.3 for i, _ in izip(cycle('1234567890'), xrange(10000)):
12 10000 18626 1.9 14.6 rc.add(i)
13
14 79 11993 151.8 9.4 while rc.max() is not None:
15 78 88966 1140.6 69.7 sleep(0.001)
list, the add function is 30 times faster, an enormous
savings. Even better, switching to Python's stdlib bisect
function cut the time it takes to find the most frequent node by 75 percent.Python Performance in Practice
Building performant systems is hard work. Duh: that's why there are so many
systems that aren't performant. The first step to improving your system is to
have measurements in place that are easy to test between changes. For my
projects, I use tox as a test runner because
it provides the flexibility to define any environments you need -- not just
unittest/py.test/nose commands.
To track performance, I use pytest-bench in a tox benchmarking
environment that's as simple as
tox -ebenchmark and spits out the results for
several test workloads. The tox.ini file below is excerpted, and available in
full here.[testenv]
// exit after 2 failures, report fail info, log the 3 slowest tests, display test coverage within the module
commands = py.test --maxfail=2 -rf --durations=3
--cov disq
--cov-report html
--cov-report term
--benchmark-skip {posargs}
setenv = VIRTUAL_ENV={envdir}
PYTHONHASHSEED=0
deps = -r{toxinidir}/requirements.txt
-r{toxinidir}/test-requirements.txt
[testenv:benchmark]
// benchmarking environment that skips all non-benchmark tests
commands = py.test -rf --benchmark-only {posargs}
[testenv:pep8]
// PEP8 environment that forces me to have consistent style
commands = pep8
setenv = VIRTUAL_ENV={envdir}
PYTHONHASHSEED=0
## Before
--- benchmark: 4 tests, min 5 rounds (of min 25.00us), 1.00s max time --
Name (time in us) Min Max Mean StdDev
test_addjob_benchmarks 72.0024 323.0572 103.5393 16.0487
test_addjob_no_replicate_bench 40.7696 173.0919 45.2473 7.1136
test_addjob_async_bench 42.9153 1088.8577 51.9152 12.2333
test_getjob_bench 79.8702 191.9270 92.0623 9.3458
## After
--- benchmark: 4 tests, min 5 rounds (of min 25.00us), 1.00s max time --
Name (time in us) Min Max Mean StdDev
test_addjob_benchmarks 71.0487 856.8764 103.6685 21.6713
test_addjob_no_replicate_bench 39.8159 432.0145 45.0144 7.7360
test_addjob_async_bench 41.0080 276.8040 44.5564 6.9397
test_getjob_bench 66.9956 213.1462 73.8683 9.1130
The real savings was in
getjob, which is where we were bisecting the sorted
list, and now use the stdlib bisect function. And now we can see when
performance regresses for new changes, since benchmarks are a part of test
runs.Optimization Lessons
Any application (Python or not) can benefit from the
verify-measure-alter-repeat pattern we used to improve the performance of disq
by more than 30 percent. Next time you get a feeling that something is doing
more work than necessary, follow your judgement and find out just how much
you're paying for the layer of indirection you just added--you might be
surprised.
All of the tools outlined here: line_profiler, profiling, tox, and pytest-bench
are worthy additions to your toolbox. Use them. Try them out on your pet
project and get comfortable with changing code to improve performance. Write
code that does as little work as possible. The disq library turned out to be
spending huge amounts of time doing unnecessary work, and our profilers were
able to guide us to it.
Post a Comment